Mostrando entradas con la etiqueta The Earth. Mostrar todas las entradas

jueves, 17 de abril de 2014

nsf.gov - National Science Foundation: Special for Earth Day: New NSF resources highlight surprising ecological and economic benefits of biodiversity

Multimedia resources explain little known societal benefits of biodiversity, bust myths and describe new, high-tech approaches for measuring impacts of environmental change on biodiversity
graphic showing various marine organisms and the text photogallery
A slideshow on how biodiversity boosts the economy.
Credit and Larger Version
April 17, 2014
Every organism on Earth, from microbes to plants to large predators, has evolved unique survival mechanisms and distinct ecological roles. For decades, the National Science Foundation (NSF) has funded basic research on how these varied organisms, which make up the Earth's biodiversity, function.
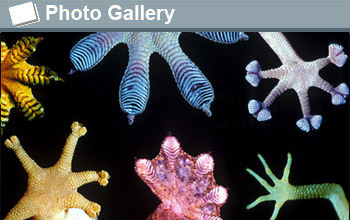
For example, recent findings about how geckos climb up vertical walls and walk across ceilings led to the development of new adhesives and wall-climbing robots that may be used to, for example, produce new gravity-defying climbing boots and help collect space junk. (Learn more about gecko-inspired discoveries in the accompanying slide show.)
Kellar Autumn of Lewis & Clark College, who helped characterize the nanophysics of the gecko's Spider Man-like abilities, said, "Geckos, which evolved 160 million years ago are so novel that engineers would never have developed nano-adhesive structures without them. It took 15 years and lots of NSF support to understand the basic physical principles of gecko adhesion and then to apply them to make them work. This suggests that there is a library of biodiversity that can be mined for valuable uses if we have enough resources and enough time--in light of high extinction rates--to really understand them."
 
New resources
Learn more about the amazingly diverse ecological and economic benefits of biodiversity and its enduring mysteries from these accompanying resources:
  • 10 Surprising Ways that Biodiversity Benefits the Economy: A slide show about how basic research on biodiversity drives innovation, boosts the economy and produces other important societal benefits.
  • Biodiversity: A Boon to Brain Research: A video about how two unlikely microbes (that don't even have brains) made possible the development of one of today's most promising brain research tools--which is being used to study many brain diseases and disorders, including schizophrenia, Parkinson's, epilepsy and anxiety.
  • NEON at a Glance: A video about the National Ecological Observatory Network (NEON)--which will be a massive nationwide infrastructure for collecting standardized long-term data on biodiversity (and other ecological variables) throughout the United States. Currently under construction and partially operational, NEON will enable scientists to generate the first apples-to-apples comparisons of ecosystem health over time. NEON will be fully operational in 2017.
  • A Google+ Hangout on the surprising ecological and economic benefits of biodiversity: Held on April 17, 2014, the Hangout covered ecological benefits of biodiversity that have been scientifically tested and others that have yet to be tested; how biodiversity boosts scientific and engineering innovation and new tools used to measure biodiversity in the face of environmental change.
Panelists in the Hangout were:
  • Ed Boyden of MIT: A neuroscientist and expert on how studies of biodiversity have helped generate revolutionary new research tools. A recent press release on Boyden's brain research reviews the contributions of biodiversity to his research advances.
  • Bradley Cardinale of the University of Michigan: An expert on the impacts of humans on biodiversity and ecosystem health, and on how losses of biodiversity may impact ecological processes.
  • Sarah Bergbreiter of the University of Maryland: An expert in insect-inspired robotics. Bergbreiter's research on micro robots was covered in a recent Science Nation video.
  • Steve Polasky of the University of Minnesota: An expert on integrating ecological and economic analyses, biodiversity conservation and ecosystem services.
  • Elizabeth Blood of NSF: NSF's program director for NEON.
-NSF-
Media Contacts Lily Whiteman, National Science Foundation, (703) 292-8310, lwhitema@nsf.gov
Related WebsitesFollowing in the Footsteps of Nature (article about gecko-inspired innovations): http://www.nsf.gov/discoveries/disc_summ.jsp?cntn_id=116297
The National Science Foundation (NSF) is an independent federal agency that supports fundamental research and education across all fields of science and engineering. In fiscal year (FY) 2014, its budget is $7.2 billion. NSF funds reach all 50 states through grants to nearly 2,000 colleges, universities and other institutions. Each year, NSF receives about 50,000 competitive requests for funding, and makes about 11,500 new funding awards. NSF also awards about $593 million in professional and service contracts yearly.
Useful NSF Web Sites:
NSF Home Page: http://www.nsf.gov
NSF News: http://www.nsf.gov/news/
For the News Media: http://www.nsf.gov/news/newsroom.jsp
Science and Engineering Statistics: http://www.nsf.gov/statistics/
Awards Searches: http://www.nsf.gov/awardsearch/
light beam on a neutron
View Video
Biodiversity: A boon for brain research.
Credit and Larger Version
Graphic illustration showing the NEON logo and a grreen field
View Video
NEON at a Glance: A quick video overview of NEON.
Credit and Larger Version

The National Science Foundation (NSF)
Guillermo Gonzalo Sánchez Achutegui

domingo, 17 de noviembre de 2013

NASA : NASA Damage Map Helps in Typhoon Disaster Response


NASA-generated damage map
When Super Typhoon Haiyan, one of the most powerful storms ever recorded on Earth, struck the Philippines Nov. 8, 2013, it tore a wide swath of destruction across large parts of the island nation.
Image Credit: ASI/NASA/JPL-Caltech
Image Token:
A new, space-based map generated by scientists at NASA’s Jet Propulsion Laboratory, Pasadena, Calif., in collaboration with the Italian Space Agency to assist in disaster response efforts shows the regions in the Philippines hit hardest by Super Typhoon Haiyan. The typhoon tore a wide swath of devastation across the island nation on Nov. 8, 2013.

The map, which depicts the storm’s destruction, is available online at:
This 27-by-33-mile (43-by-53-kilometer) map covers a region near Tacloban City, where the massive storm, one of the most powerful ever recorded on Earth, made landfall. It was made from radar imagery obtained before and after the typhoon hit. It was processed by JPL’s Advanced Rapid Imaging and Analysis (ARIA) team using X-band interferometric synthetic aperture radar data from the Italian Space Agency’s COSMO-SkyMed satellite constellation. The technique uses a prototype algorithm to rapidly detect surface changes caused by natural or human-produced damage.
The technique is most sensitive to detecting destruction of the human-made environment. In the image, damage detected by radar is shown as an overlay on a Google Earth image. Areas in red reflect the heaviest damage to cities and towns in the storm’s path. The estimated intensity of damage is proportional to the opacity of the red. When the radar observes areas that have little to no destruction, its image pixels are transparent. The satellite data used to generate the map span the time frame from Aug. 19 to Nov. 11, 2013. Each pixel in the damage map measures approximately 33 yards (30 meters) across.
ARIA is a JPL- and NASA-funded project being developed by JPL and the California Institute of Technology, Pasadena, Calif. It is building an automated system for providing rapid and reliable GPS and satellite data to support the local, national and international hazard monitoring and response communities. Using space-based imagery of disasters, ARIA data products can provide rapid assessments of the geographic region affected by a disaster, as well as detailed imaging of the locations where damage occurred.
NASA is making the data publicly available for agencies that might be responding to the event through the U.S. Geological Survey’s Earth Resources Observation and Science (EROS) Data Center’s Hazards Data Distribution System, as well as through NASA’s ARIA website.
The ARIA team began developing and evaluating this technique using case studies from the magnitude 6.3 earthquake in Christchurch, New Zealand, in February 2011 to detect building damage, landslides and liquefaction. Following the magnitude 9.0 earthquake in Tohoku, Japan, in March 2011, the team used the technique to assess tsunami damage, as well as ground deformation from high-rate GPS network and imaging radar satellites. Those ground-deformation data were downloaded more than 1,400 times within the first two days they were available. Following last year’s Hurricane Sandy, the team produced damage maps that were delivered to the International Charter 11 days after landfall and subsequently validated with crowdsourcing with the assistance of the GISCorps.
The ARIA team continues to improve its response time for generating products -- the Haiyan satellite data were available three days after landfall and were processed within 11 hours of data acquisition. The improved response time has been aided by NASA’s recent joint collaboration with the Italian Space Agency, which operates four identical radar satellites.
For more information about ARIA, visit:
Caltech manages JPL for NASA.
Alan Buis 818-354-0474
Jet Propulsion Laboratory, Pasadena, Calif.
Alan.buis@jpl.nasa.gov
NASA
Guillermo Gonzalo Sánchez Achutegui
ayabaca@gmail.com
ayabaca@hotmail.com
ayabaca@yahoo.com

domingo, 11 de agosto de 2013

NASA - NASA Selects Launch Services Contract for OSIRIS-REx Mission

Heliophysics Nugget: Mapping Tons of Meteoric Dust in the Sky
 
a shooting star
Larger meteoroids cause bright flashes of light when they hit Earth's atmosphere, such as this fireball caught during the Perseid meteor shower Aug. 12, 2006. The bulk of meteoric activity is much less showy: Some 10 to 40 tons of meteor dust enter our atmosphere every day.
Image Credit:  Courtesy of Pierre Martin
Image Token:
Heliophysics nuggets are a collection of early science results, new research techniques, and instrument updates that further our attempt to understand the sun and the dynamic space weather system that surrounds Earth.

On Aug.11 and 12, 2013, the annual Perseid meteor shower will peak, filling the sky with streaks of light, commonly known as shooting stars. Such visually stunning showers are actually but the tip of the iceberg when it comes to meteoroids slamming into Earth's atmosphere: Some 10 to 40 tons of material of invisible meteoric dust enters the atmosphere from interplanetary space every day.
The big showers like the Perseids, and later the Leonids in November, are caused when Earth and its atmosphere travels through a region of the sky filled with left over debris lost by a particular comet. In the case of the Perseids, the small fragments were ripped of the tail of comet Swift-Tuttle, which orbits the sun once every 130 years. The fragments light up due to the immense friction created when they plough into the gas surrounding Earth. Each such fragment is approximately the size of a dime, but the more constant, sporadic meteoroids have been around much longer, breaking down over time into tiny fragments only about as wide as a piece of human hair.
"This is interplanetary dust," said Diego Janches, who studies micrometeoroids at NASA's Goddard Space Flight Center in Greenbelt, Md. "The fragments are either remnants from the solar system's formation, or they are produced by collisions between asteroids or comets from long ago."
Janches researches such tiny meteoroids using radar systems set up around the globe, in places such as Sweden, Puerto Rico and Alaska, or the radar system he deployed and operates in Tierra Del Fuego, Argentina. These fragments plough into Earth's atmosphere at speeds of between 7 to 44 miles per second. They also bring with them minerals and metals from their parent bodies, such as sodium, silicon, calcium and magnesium.
"The small meteoroids feed the atmosphere with all these extra materials," Janches said. "They come in, release metallic atoms that get deposited in the mesosphere and then get pushed around from pole to pole by the general global circulation. So by using the metals as tracers, you can answer some important questions about the general composition and movement of the atmosphere."
The radar systems set up around the world can track such motion. The meteors collide with atoms in the atmosphere and leave behind a path of electrons and charged particles. This electrically charged region acts as a perfect mirror for radar waves, so the radar bounces back carrying both position information and Doppler shift information. This can be used to measure speed and direction of the background atmospheric winds at the altitudes where the meteoric tails are produced, between 40 and 60 miles high in the sky. Because there are so many such trails, they can be used to measure the velocity and direction of the winds continuously, helping to map out very complex wind patterns on a minute-by-minute basis.
Similar techniques, but using lasers, can be used to map how something like sodium sweeps through the entire atmosphere, thus tracing the global circulation system. This system also sweeps the meteoric dust to the poles where, during the summertime, they can serve as nuclei for ice crystals in the sky forming what's called night-shining or noctilucent clouds.
Karen C. Fox
NASA's Goddard Space Flight Center, Greenbelt, Md.
NASA Selects Launch Services Contract for OSIRIS-REx Mission
NASA has selected United Launch Services LLC of Englewood, Colo. to launch the Origins-Spectral Interpretation-Resource Identification-Security-Regolith Explorer (OSIRIS-REx) spacecraft.
The OSIRIS-REx mission is scheduled to launch in September 2016 aboard an Atlas V rocket from Space Launch Complex 41 at Cape Canaveral Air Force Station, Fla.
NASA's total cost to launch OSIRIS-REx is apporixmately $183.5 million, including payload processing, integrated services, telemetry and other launch support requirements.
OSIRIS-REx will survey near-Earth asteroid 101955 Bennu to understand its physical, mineralogical and chemical properties; assess its resource potential; refine the impact hazard; and return a sample to Earth. The spacecraft will rendezvous with the asteroid in 2018. Sample return is planned in 2023. Analysis of the sample returned will reveal the earliest stages of the solar system's evolution and the history of Bennu over the past 4.5 billion years.
OSIRIS-REx also will study the Yarkovsky effect, a non-gravitational force affecting the orbit of this potentially hazardous asteroid, and provide the first direct measurements for telescopic observations of this type of asteroids.
NASA's Launch Services Program at the agency's Kennedy Space Center in Florida is responsible for program management of the Atlas V launch vehicle. NASA's Goddard Space Flight Center in Greenbelt, Md., provides overall mission management for OSIRIS-REx.
For more information about NASA programs and missions, visit:
NASA
Guillermo Gonzalo Sánchez Achutegui

domingo, 4 de agosto de 2013

NASA - First Hint of Sunrise From Space


On July 30, 2013, Expedition 36 Flight Engineer Karen L. Nyberg of NASA took this photograph of a sunrise viewed from the International Space Station. As the space station orbits the Earth every 90 minutes, traveling at about 17,500 miles per hour, the crew sees about 16 sunrises and sunsets daily.
Image Credit: NASA
NASA
Guillermo Gonzalo Sánchez Achutegui
ayabaca@gmail.com
ayabaca@hotmail.com
ayabaca@yahoo.com

domingo, 30 de junio de 2013

ESA - “The sky is simply perfect.”


ESA astronaut Luca Parmitano in full spacewalk gear before the start of his Volare mission to the International Space Station. The suit he is wearing protects astronauts from the vacuum in space when they venture outside. Luca has three spacewalks planned during his six-month mission. 


ESA astronaut Luca Parmitano is spending six months on the International Space Station conducting experiments and keeping the orbital outpost running with five colleague astronauts. 
In Luca’s spare time he photographs our world from 400 km high, looking out of the Station’s panoramic Cupola. Luca tweeted the picture above with the comment: “The sky is simply perfect.” Of course, for people living down below, the weather would have been described as “patchy, with sunlight coming through at times”.
Orbiting at 28 800 km/h, Luca is privileged to see our planet from a unique perspective. Here, Earth’s curvature is clearly visible, with the thin layer of pale blue atmosphere separating us from the harshness of space.
To see more of Luca's incredible shots, please visit the Volare mission Flickr channel.

RELATED IMAGES

ESA
Guillermo Gonzalo Sánchez Achutegui
ayabaca@gmail.com
ayabaca@hotmail.com
ayabaca@yahoo.com

domingo, 2 de junio de 2013

ESA - Image of the week: Crete


EARTH FROM SPACE: CRETE
31 May 2013
This image shows northwestern Crete, the largest and most populous of the Greek islands, some 250 km long and 40 km wide.
Crete, which separates the Aegean and Libyan Seas in the eastern Mediterranean, is home to numerous beaches, fertile plateaus, caves and high mountains.
The island’s economy is predominantly based on agriculture, with significant vineyards, olive groves and citrus crops. Dairy is also very important, with a variety of sheep and goat cheeses available.
In the lower-right, the bright cluster of radar reflections on the northern coast is the city of Chania, the island’s second largest city after Heraklion (not pictured).
At the centre of the image is the Rodopou Peninsula. It is about 8 km long and 5 km wide. While the southern part of the peninsula is dotted with small villages, the northern part is practically uninhabited barring the shepherds.
Off the coast of the other peninsula to the left there are two small islands: Imeri Gramvousa to the south and Agria Gramvousa due north. Both are uninhabited, but the southern island hosts ruins of a Venetian fort and structures of Cretan insurgents in the 1820s – who resorted to piracy to survive.
This image is a compilation of three radar images from Japan’s ALOS satellite acquired on 28 August 2010, 13 October 2010 and the third band created by combining the other two.
This image is featured on the Earth from Space video programme.
ESA
Guillermo Gonzalo Sánchez Achutegui
ayabaca@gmail.com
ayabaca@hotamil.com
ayabaca@yahoo.com

domingo, 17 de febrero de 2013

ESA - GOCE settles debate on sloping sea


Sea level station
  (423.17 kB)
 The sea level station at Vaca Key in Florida. The white tube extending down to the water is an acoustic tide gauge. The hut houses the electronics while the roof contains communications equipment and solar panels. The station is also equipped with a weather station and GPS equipment.
 
15 February 2013 For decades, scientists have disagreed about whether the sea is higher or lower heading north along the east coast of North America. Thanks to precision gravity data from ESA’s GOCE satellite, this controversial issue has now been settled. The answer? It’s lower.
Many might assume that the height of the sea is the same everywhere – but this is not true because winds, currents, tides and different temperatures cause seawater to pile up in some regions and dip in others.
However, it is difficult to determine relative heights of the sea, especially near the coast. To do this, tide gauge measurements need to be compared with a ‘level’ surface.
The old method of making these calculations involved conventional levelling, carrying surveying instruments thousands of kilometres and combining measurements in the national surveying datums that were assumed to be level reference surfaces.
Sea slope discussions
  (144.12 kB)
 The discussion between geodesists and oceanographers about whether the height of the sea increases or decreases along the east coast of North America go back to 1927 when William Bowie published Tilting of mean sea level.

Until recently, geodesists thought that the height of the sea increased with latitude along the Atlantic coast from Florida to Canada. Their conclusions, which go back to the 1920s, were based on traditional methods that connect values of mean sea level from tide gauge measurements.
This ran counter to the intuition of most oceanographers, who were aware of the influence that the Gulf Stream would have on the height of the sea along the coast.
Most modern computer models of ocean circulation suggest that sea level falls travelling north, especially along the Florida coast. As this major current then sweeps away from North Carolina, coastal sea level should be essentially flat thereafter. This contrasts with the Pacific coast where there is no significant slope with latitude.
GOCE geoid


ESA's GOCE mission has delivered the most accurate model of the 'geoid' ever produced, which will be used to further our understanding of how Earth works.
The colours in the image represent deviations in height (–100 m to +100 m) from an ideal geoid. The blue shades represent low values and the reds/yellows represent high values.
A precise model of Earth's geoid is crucial for deriving accurate measurements of ocean circulation, sea-level change and terrestrial ice dynamics. The geoid is also used as a reference surface from which to map the topographical features on the planet. In addition, a better understanding of variations in the gravity field will lead to a deeper understanding of Earth's interior, such as the physics and dynamics associated with volcanic activity and earthquakes.

GOCE maps variations in Earth’s gravity with extreme detail. The result is a unique model of the ‘geoid’, which is essentially a virtual surface where water does not flow from one point to another.
The new geoid and in situ gravity measurements have been used as a reference to establish levelling heights. Combining the GOCE geoid and GPS heights at tide gauges provides indirect means of calculating sea heights by levelling along coastlines.
Through ESA’s Support to Science Element programme, scientists from the National Oceanographic Centre Liverpool in the UK, the Technical University of Munich in Germany and Newcastle University in the UK have developed a new method that largely uses GOCE data to determine a reference level surface.
Sea slope
 
 The red and blue dots show values of mean sea level (MSL) measured with respect to national datums in the US and Canada (red and blue, respectively). These data indicate that the height of the sea increases travelling north from Florida to Canada. However, most modern numerical models of ocean circulation (black dots) suggest that the slope of the sea should actually decrease travelling north and can be explained by the effects of the Gulf Stream in this region of the Atlantic Ocean. The new geoid from ESA’s GOCE gravity mission has resolved this long-debated mystery by providing conclusive proof that the height of the sea does, indeed, drop (yellow dots).

This work complements that of Dalhousie University in Canada and other oceanographic research groups also making use of new geoid information.
Philip Woodworth from the National Oceanographic Centre Liverpool said, “GOCE has resolved this old debate in the oceanographers’ favour.
“The results prove conclusively that sea level decreases going north along the North American Atlantic coastline, in agreement with the ocean models.”
Similar results agreeing with the ocean model have also been obtained along the North Pacific and European coastlines.
GOCE in orbit

 GOCE orbit is so low that it experiences drag from the outer edges of Earth's atmosphere. The satellite's streamline structure and use of electric propulsion system counteract atmospheric drag to ensure that the data are of true gravity.

Dru Smith from the US National Geodetic Survey said, “Since the issue was raised in 1927 studies showed a mismatch between classical and modern observations on land. The new results, however, settle the argument convincingly and are relevant for both North American coastlines. The findings are important for establishing a common height reference system between the US, Canada and Mexico.”
Reiner Rummel from the Technical University of Munich added, “We have to admit that we geodesists were wrong and the oceanographers were right. As both geoid and ocean models continue to improve, we can expect to learn many more interesting details about sea level and ocean circulation.
“Importantly, data from GOCE will lead to a unified global height system so that we can consistently study sea-level change apparent in tide gauge and satellite altimetry data.”
RELATED ARTICLES:
ESA
Guillermo Gonzalo Sánchez Achutegui
ayabaca@gmail.com
ayabaca@hotmail.com
ayabaca@yahoo.com

domingo, 10 de febrero de 2013

ESA - Is the ozone layer on the road to recovery?


http://upload.wikimedia.org/wikipedia/commons/4/46/Future_ozone_layer_concentrations.gif
Full resolution(1,280 × 932 pixels, file size: 2.01 MB, MIME type: image/gif, looped, 6 frames, 18 s)
NASA projections of stratospheric ozone concentrations if chlorofluorocarbons had not been banned.

Regulation

In 1978, the United States, Canada and Norway enacted bans on CFC-containing aerosol sprays that are thought to damage the ozone layer. The European Community rejected an analogous proposal to do the same. In the U.S., chlorofluorocarbons continued to be used in other applications, such as refrigeration and industrial cleaning, until after the discovery of the Antarctic ozone hole in 1985. After negotiation of an international treaty (the Montreal Protocol), CFC production was sharply limited beginning in 1987 and phased out completely by 1996.[citation needed] Since that time, the treaty has been amended to ban CFC production after 1995 in the developed countries, and later in developing. Today, over 160 countries have signed the treaty. Beginning January 1, 1996, only recycled and stockpiled CFCs will be available for use in developed countries like the US. This production phaseout is possible because of efforts to ensure that there will be substitute chemicals and technologies for all CFC uses.[7]
On August 2, 2003, scientists announced that the depletion of the ozone layer may be slowing down due to the international ban on CFCs.[8] Three satellites and three ground stations confirmed that the upper atmosphere ozone depletion rate has slowed down significantly during the past decade. The study was organized by the American Geophysical Union. Some breakdown can be expected to continue due to CFCs used by nations which have not banned them, and due to gases which are already in the stratosphere. CFCs have very long atmospheric lifetimes, ranging from 50 to over 100 years. It has been estimated that the ozone layer may not recover until 2075.[9]
Compounds containing C–H bonds (such as hydrochlorofluorocarbons, or HCFCs) have been designed to replace the function of CFCs. These replacement compounds are more reactive and less likely to survive long enough in the atmosphere to reach the stratosphere where they could affect the ozone layer. While being less damaging than CFCs, HCFCs can have a negative impact on the ozone layer, so they are also being phased out.[10]
Wikipedia.
File:Ozone cycle.svgFull resolution(SVG file, nominally 1,052 × 744 pixels, file size: 420 KB)

The ozone layer is a layer in Earth's atmosphere containing relatively high concentrations of ozone (O3). However, "relatively high," in the case of ozone, is still very small with regard to ordinary oxygen, and is less than ten parts per million, with the average ozone concentration in Earth's atmosphere being only about 0.6 parts per million. The ozone layer is mainly found in the lower portion of the stratosphere from approximately 20 to 30 kilometres (12 to 19 mi) above Earth, though the thickness varies seasonally and geographically.[1]
The ozone layer was discovered in 1913 by the French physicists Charles Fabry and Henri Buisson. Its properties were explored in detail by the British meteorologist G. M. B. Dobson, who developed a simple spectrophotometer (the Dobsonmeter) that could be used to measure stratospheric ozone from the ground. Between 1928 and 1958 Dobson established a worldwide network of ozone monitoring stations, which continue to operate to this day. The "Dobson unit", a convenient measure of the columnar density of ozone overhead, is named in his honor.
The ozone layer absorbs 97–99% of the Sun's medium-frequency ultraviolet light (from about 200 nm to 315 nm wavelength), which potentially damages exposed life forms on Earth.[2]
Wikipedia.

8 February 2013 Satellites show that the recent ozone hole over Antarctica was the smallest seen in the past decade. Long-term observations also reveal that Earth’s ozone has been strengthening following international agreements to protect this vital layer of the atmosphere.
According to the ozone sensor on Europe’s MetOp weather satellite, the hole over Antarctica in 2012 was the smallest in the last 10 years.
The instrument continues the long-term monitoring of atmospheric ozone started by its predecessors on the ERS-2 and Envisat satellites.
Since the beginning of the 1980s, an ozone hole has developed over Antarctica during the southern spring – September to November – resulting in a decrease in ozone concentration of up to 70%.
South Pole ozone
Ozone depletion is more extreme in Antarctica than at the North Pole because high wind speeds cause a fast-rotating vortex of cold air, leading to extremely low temperatures. Under these conditions, human-made chlorofluorocarbons – CFCs – have a stronger effect on the ozone, depleting it and creating the infamous hole.
Over the Arctic, the effect is far less pronounced because the northern hemisphere’s irregular landmasses and mountains normally prevent the build-up of strong circumpolar winds.
Reduced ozone over the southern hemisphere means that people living there are more exposed to cancer-causing ultraviolet radiation.
International agreements on protecting the ozone layer – particularly the Montreal Protocol – have stopped the increase of CFC concentrations, and a drastic fall has been observed since the mid-1990s.
However, the long lifetimes of CFCs in the atmosphere mean it may take until the middle of this century for the stratosphere’s chlorine content to go back to values like those of the 1960s.
The evolution of the ozone layer is affected by the interplay between atmospheric chemistry and dynamics like wind and temperature.
If weather and atmospheric conditions show unusual behaviour, it can result in extreme ozone conditions – such as the record low observed in spring 2011 in the Arctic – or last year’s unusually small Antarctic ozone hole.
Total ozone
To understand these complex processes better, scientists rely on a long time series of data derived from observations and on results from numerical simulations based on complex atmospheric models.
Although ozone has been observed over several decades with multiple instruments, combining the existing observations from many different sensors to produce consistent and homogeneous data suitable for scientific analysis is a difficult task.
Within the ESA Climate Change Initiative, harmonised ozone climate data records are generated to document the variability of ozone changes better at different scales in space and time.
With this information, scientists can better estimate the timing of the ozone layer recovery, and in particular the closure of the ozone hole.
Chemistry climate models show that the ozone layer may be building up, and the hole over Antarctica will close in the next decades.
ESA
Guillermo Gonzalo Sánchez Achutegui
ayabaca@gmail.com
ayabaca@hotmail.com
ayabaca@yahoo.com

martes, 15 de enero de 2013

NASA - NASA Finds 2012 Sustained Long-Term Climate Warming Trend

NASA's analysis of Earth's surface temperature found that 2012 ranked as the ninth-warmest year since 1880. NASA scientists at the Goddard Institute for Space Studies (GISS) compare the average global temperature each year to the average from 1951 to 1980. This 30-year period provides a baseline from which to measure the warming Earth has experienced due to increasing atmospheric levels of heat-trapping greenhouse gases. While 2012 was the ninth-warmest year on record, all 10 of the warmest years in the GISS analysis have occurred since 1998, continuing a trend of temperatures well above the mid-20th century average. The record dates back to 1880 because that is when there were enough meteorological stations around the world to provide global temperature data.
Data source: NASA Goddard Institute for Space Studies
Visualization credit: NASA Goddard's Scientific Visualization Studio
› Download this video and related materials in HD formats

http://www.nasa.gov/images/content/719282main_2008_2012_printdata.1462.jpg
This map represents global temperature anomalies averaged from 2008 through 2012.
Data source: NASA Goddard Institute for Space Studies
Visualization credit: NASA Goddard's Scientific Visualization Studio
› Larger image
› Larger image (tif)
› Color bar scale (png)


NASA Finds 2012 Sustained Long-Term Climate Warming Trend
 
 
WASHINGTON -- NASA scientists say 2012 was the ninth warmest of any year since 1880, continuing a long-term trend of rising global temperatures. With the exception of 1998, the nine warmest years in the 132-year record all have occurred since 2000, with 2010 and 2005 ranking as the hottest years on record.

NASA's Goddard Institute for Space Studies (GISS) in New York, which monitors global surface temperatures on an ongoing basis, released an updated analysis Tuesday that compares temperatures around the globe in 2012 to the average global temperature from the mid-20th century. The comparison shows how Earth continues to experience warmer temperatures than several decades ago.

The average temperature in 2012 was about 58.3 degrees Fahrenheit (14.6 Celsius), which is 1.0 F (0.6 C) warmer than the mid-20th century baseline. The average global temperature has risen about 1.4 degrees F (0.8 C) since 1880, according to the new analysis.

Scientists emphasize that weather patterns always will cause fluctuations in average temperature from year to year, but the continued increase in greenhouse gas levels in Earth's atmosphere assures a long-term rise in global temperatures. Each successive year will not necessarily be warmer than the year before, but on the current course of greenhouse gas increases, scientists expect each successive decade to be warmer than the previous decade.

"One more year of numbers isn't in itself significant," GISS climatologist Gavin Schmidt said. "What matters is this decade is warmer than the last decade, and that decade was warmer than the decade before. The planet is warming. The reason it's warming is because we are pumping increasing amounts of carbon dioxide into the atmosphere."

Carbon dioxide is a greenhouse gas that traps heat and largely controls Earth's climate. It occurs naturally and also is emitted by the burning of fossil fuels for energy. Driven by increasing man-made emissions, the level of carbon dioxide in Earth's atmosphere has been rising consistently for decades.

The carbon dioxide level in the atmosphere was about 285 parts per million in 1880, the first year in the GISS temperature record. By 1960, the atmospheric carbon dioxide concentration, measured at NOAA's Mauna Loa Observatory, was about 315 parts per million. Today, that measurement exceeds 390 parts per million.

While the globe experienced relatively warm temperatures in 2012, the continental U.S. endured its warmest year on record by far, according to NOAA, the official keeper of U.S. weather records.

"The U.S. temperatures in the summer of 2012 are an example of a new trend of outlying seasonal extremes that are warmer than the hottest seasonal temperatures of the mid-20th century," GISS director James E. Hansen said. "The climate dice are now loaded. Some seasons still will be cooler than the long-term average, but the perceptive person should notice that the frequency of unusually warm extremes is increasing. It is the extremes that have the most impact on people and other life on the planet."

The temperature analysis produced at GISS is compiled from weather data from more than 1,000 meteorological stations around the world, satellite observations of sea-surface temperature, and Antarctic research station measurements. A publicly available computer program is used to calculate the difference between surface temperature in a given month and the average temperature for the same place during 1951 to 1980. This three-decade period functions as a baseline for the analysis. The last year that experienced cooler temperatures than the 1951 to 1980 average was 1976.

The GISS temperature record is one of several global temperature analyses, along with those produced by the Met Office Hadley Centre in the United Kingdom and the National Oceanic and Atmospheric Administration's National Climatic Data Center in Asheville, N.C. These three primary records use slightly different methods, but overall, their trends show close agreement.

For images related to the data, visit:
 
NASA


Guillermo Gonzalo Sánchez Achutegui
ayabaca@gmail.com
ayabaca@hotmail.com
ayabaca@yahoo.com 

domingo, 18 de noviembre de 2012

ESA - Space Science - Snap the stars to see your photo on ESA portal


Transit of Venus as seen from Canberra, Australia
Download:
Transit of Venus as seen from Canberra, Australia, 2012. 
Credits: Manuel Castillo-Fraile and Miguel Sánchez-Portal

Have you taken an interesting astronomical photo this year? From planets and moons to the Sun, stars and galaxies, we’d like you to send us your images to feature as our Space Science Image of the Week on 31 December.

The ESA Space Science team’s favourite image will take the slot of our weekly image during the week beginning 31 December 2012 as a celebration of the astronomical events of the year gone by. The best of the rest will feature in our dedicated ESA Space Science images Flickr gallery. During 2012, the sky has staged a series of astronomical theatrics to provide plenty of inspiration for your entry. Perhaps you were lucky enough to observe a solar eclipse, or even the transit of Venus. Maybe you snapped a meteor streaking through the sky, or perhaps you found beauty in the constellations this year. Images of galaxies and nebulae are also welcomed. 
 

Totality
Download:
The total solar eclipse of 13/14 November 2012. The clouds cleared in time for observers at Palm Cove, Australia, to experience totality as the Moon totally obscured the Sun for around two minutes, revealing the Sun's bright corona. 
Credits: Anik De Groof

If you would like to participate but have yet to capture the perfect image, here are some upcoming events to spark some ideas:
17/18 November: Leonids meteor shower – watch ‘shooting stars’ rain from the constellation of Leo this weekend as Earth bumps into debris from Comet Tempel-Tuttle.
27 November: conjunction between Venus and the ringed planet Saturn – the two planets meet to within 1º before sunrise for European observers. With an unobstructed horizon, you may also glimpse Mercury.
28 November: penumbral lunar eclipse – watch the Moon enter Earth’s faint outer shadow (beginning 12:14 GMT and ending 16:51 GMT)
3 December: Jupiter at opposition – the gas giant will be at its closest approach to Earth with its face fully illuminated by the Sun, providing ideal conditions to view and photograph the planet with its four Galilean moons.
 We invite you to photograph these events – or review your images taken during 2012 – and submit your best shot to scicom@esa.int by Monday 10 December. Images will be judged mainly on their aesthetic value.
Amateur photographers and astronomers from around the world are encouraged to participate.
Please include your name, contact email address, your geographical location, the date you took the image, the camera/telescope you used, and any imaging/processing details that you would like to share.
The image must have been taken in 2012 and only one entry per person, please.
ESA
Guillermo Gonzalo Sánchez Achutegui
ayabaca@gmail.com
ayabaca@hotmail.com
ayabaca@yahoo.com

miércoles, 25 de abril de 2012

Astronomy: NASA Scientists Find History of Asteroid Impacts in Earth Rocks

Hi My Friends: A VUELO DE UN QUINDE EL BLOG., Research by NASA and international scientists concludes giant asteroids, similar or larger than the one believed to have killed the dinosaurs, hit Earth billions of years ago with more frequency than previously thought.

NASA Scientists Find History of Asteroid Impacts in Earth Rocks :
WASHINGTON -- Research by NASA and international scientists concludes giant asteroids, similar or larger than the one believed to have killed the dinosaurs, hit Earth billions of years ago with more frequency than previously thought.

To cause the dinosaur extinction, the killer asteroid that impacted Earth 65 million years ago would have been almost 6 miles (10 kilometers) in diameter. By studying ancient rocks in Australia and using computer models, researchers estimate that approximately 70 asteroids the same size or larger impacted Earth 1.8 to 3.8 billion years ago. During the same period, approximately four similarly-sized objects hit the moon.

"This work demonstrates the power of combining sophisticated computer models with physical evidence from the past, further opening an important window to Earth's history," said Yvonne Pendleton, director of NASA's Lunar Science Institute (NLSI) at NASA's Ames Research Center at Moffett Field, Calif.

Evidence for these impacts on Earth comes from thin rock layers that contain debris of nearly spherical, sand-sized droplets called spherules. These millimeter-scale clues were formerly molten droplets ejected into space within the huge plumes created by mega-impacts on Earth. The hardened droplets then fell back to Earth, creating thin but widespread sedimentary layers known as spherule beds.
The new findings are published today in the journal Nature.

"The beds speak to an intense period of bombardment of Earth," said William Bottke principal investigator of the impact study team at the Southwest Research Institute (SwRI) in Boulder, Colo. "Their source long has been a mystery."

The team's findings support the theory Jupiter, Saturn, Uranus and Neptune formed in different orbits nearly 4.5 billion years ago, migrating to their current orbits about 4 billion years ago from the interplay of gravitational forces in the young solar system. This event triggered a solar system-wide bombardment of comets and asteroids called the "Late Heavy Bombardment." In the paper, the team created a model of the ancient main asteroid belt and tracked what would have happened when the orbits of the giant planets changed. They discovered the innermost portion of the belt became destabilized and could have delivered numerous big impacts to Earth and the moon over long time periods.

At least 12 mega-impacts produced spherule beds during the so-called Archean period 2.5 to 3.7 billion years ago, a formative time for life on Earth. Ancient spherule beds are rare finds, rarer than rocks of any other age. Most of the beds have been preserved amid mud deposited on the sea floor below the reach of waves.

The impact believed to have killed the dinosaurs was the only known collision over the past half-billion years that made a spherule layer as deep as those of the Archean period. The relative abundance of the beds supports the hypothesis for many giant asteroid impacts during Earth's early history.

The frequency of the impacts indicated in the computer models matches the number of spherule beds found in terrains with ages that are well understood. The data also hint at the possibility that the last impacts of the Late Heavy Bombardment on Earth made South Africa's Vredefort crater and Canada's Sudbury crater, both of which formed about 2 billion years ago.

"The Archean beds contain enough extraterrestrial material to rule out alternative sources for the spherules, such as volcanoes," said Bruce Simonson, a geologist from Oberlin College in Oberlin, Ohio.

The research was funded by NLSI and conducted by members or associates of NLSI's Center of Lunar Origin and Evolution, based at SwRI.

The impact study team also includes scientists from Purdue University in West Lafayette, Ind.; Charles University in Prague, Czech Republic; Observatorie de la Cote d'Azur in Nice, France; and Academia Sinica in Taipei, Taiwan.

To learn about the NLSI, visit:
http://lunarscience.arc.nasa.gov/
Guillermo Gonzalo Sánchez Achutegui

domingo, 4 de marzo de 2012

Astronomy: NASA's Kepler Releases New Catalog- 2,321 Planet Candidates

Hi My Friends: AL VUELO DE UN QUINDE EL BLOG., The histogram summarizes the findings in the Feb. 27, 2012 Kepler Planet Candidate catalog release. The catalog contains 2,321 planet candidates identified during the first 16 months of observation conducted May 2009 to September 2010. Of the 46 planet candidates found in the habitable zone, the region in the planetary system where liquid water could exist, ten of these candidates are near-Earth-size. Kepler Planet Candidates by Size, Feb. 27, 2012
The histogram summarizes the findings in the Feb. 27, 2012 Kepler Planet Candidate catalog release. The catalog contains 2,321 planet candidates identified during the first 16 months of observation conducted May 2009 to September 2010. Of the 46 planet candidates found in the habitable zone, the region in the planetary system where liquid water could exist, ten of these candidates are near-Earth-size.

Credit: NASA Ames/Wendy Stenzel.


Since science operations began in May 2009, the Kepler team has released two catalogs of transiting planet candidates. The first catalog (Borucki et al, 2010), released in June 2010, contains 312 candidates identified in the first 43 days of Kepler data. The second catalog (Borucki et al, 2011), released in February 2011, is a cumulative catalog containing 1,235 candidates identified in the first 13 months of data.

Today the team presents the third catalog containing 1,091 new planet candidates identified in the first 16 months of observation conducted May 2009 to September 2010. These are the same candidates that the team discussed at the Kepler Science Conference held at NASA Ames Research Center in December 2011.

Here are the highlights of the new catalog:
A.- Planet candidates smaller than twice the size of Earth increased by 197 percent, compared to 52 percent for candidates larger than twice the size of Earth.
B.- Planet candidates with orbital periods longer than 50 days increased by 123 percent, compared to 85 percent for candidates with orbital periods shorter than 50 days. Since the last catalog was released in February 2011, the number of planet candidates identified by Kepler has increased by 88 percent and now totals 2,321 transiting 1,790 stars.

The cumulative catalog now contains well over 200 Earth-size planet candidates and more than 900 that are smaller than twice Earth-size. Of the 46 planet candidates found in the habitable zone, the region in the planetary system where liquid water could exist, ten of these candidates are near-Earth-size.

The number of planetary systems found with more than one planet candidate also has increased. Last year, 17 percent, or 170 stars, had more than one transiting planet candidate. Today, 20 percent, or 365, stars have more than one.

"With each new catalog release a clear progression toward smaller planets at longer orbital periods is emerging, " said Natalie Batalha, Kepler deputy science team lead at San Jose State University in California. "This suggests that Earth-size planets in the habitable zone are forthcoming if, indeed, such planets are abundant.

"Nearly 5,000 periodic transit-like signals were analyzed with known spacecraft instrumentation and astrophysical phenomena that could masquerade as transits, which can produce false positives. The most common false positive signatures are associated with eclipsing binary stars- a pair of orbiting stars that eclipse each other from the vantage point of the spacecraft.

The Kepler space telescope identifies planet candidates by repeatedly measuring the change in brightness of more than 150,000 stars in search of planets that pass in front, or "transit," their host star. Kepler must record at least three transits to verify a signal as a planet.


The catalog is available at the Kepler data archive at the Space Telescope Science Institute and can be downloaded from the NASA Exoplanet Archive.

NASA's Ames Research Center in Moffett Field, Calif., manages Kepler's ground system development, mission operations and science data analysis. NASA’s Jet Propulsion Laboratory, Pasadena, Calif., managed the Kepler mission's development.

Ball Aerospace and Technologies Corp. in Boulder, Colo., developed the Kepler flight system and supports mission operations with the Laboratory for Atmospheric and Space Physics at the University of Colorado in Boulder.

The Space Telescope Science Institute in Baltimore archives, hosts and distributes Kepler science data. Kepler is NASA's 10th Discovery Mission and is funded by NASA's Science Mission Directorate at the agency's headquarters in Washington.

For information about the Kepler Mission,

visit: http://www.nasa.gov/kepler
Guillermo Gonzalo Sánchez Achutegui
ayabaca@gmail.com