Mostrando entradas con la etiqueta Antarctica. Mostrar todas las entradas

domingo, 19 de octubre de 2014

NASA : NASA Begins Sixth Year of Airborne Antarctic Ice Change Study

Hola amigos: AL VUELO DE UN QUINDE EL BLOG., la Agencia Espacial NASA, nos informa sobre sus estudios en la Antártica sobre que  comienza Sexto Año de Airborne Antártida Estudio Cambio de Hielo. Ellos dicen..."NASA está llevando a cabo su sexto año consecutivo de vuelos de investigación Operación IceBridge sobre la Antártida para estudiar los cambios en la capa de hielo del continente, glaciares y hielo marino. Campaña aérea de este año, que comenzó su primer vuelo la mañana del jueves, volverá a examinar una sección de la capa de hielo de la Antártida que hace poco se encontró que en un declive irreversible.........
Para las próximas semanas, los investigadores volarán a bordo de aviones de investigación de la NASA DC-8 de Punta Arenas, Chile. Este año también marca el regreso de la Antártida occidental tras la campaña de 2013 con base en la estación McMurdo de la Fundación Nacional de Ciencia.....
NASA’s DC-8 research aircraft will be flying scientists and instruments over Antarctica to study changes in the continent’s ice sheet, glaciers and sea ice.
Image Credit: 
NASA
 
NASA is carrying out its sixth consecutive year of Operation IceBridge research flights over Antarctica to study changes in the continent’s ice sheet, glaciers and sea ice. This year’s airborne campaign, which began its first flight Thursday morning, will revisit a section of the Antarctic ice sheet that recently was found to be in irreversible decline.
For the next several weeks, researchers will fly aboard NASA’s DC-8 research aircraft out of Punta Arenas, Chile. This year also marks the return to western Antarctica following 2013’s campaign based at the National Science Foundation’s McMurdo Station.
“We are curious to see how much these glaciers have changed in two years,” said Eric Rignot, IceBridge science team co-lead and glaciologist at the University of California, Irvine and NASA’s Jet Propulsion Laboratory (JPL) in Pasadena, California.
IceBridge will use a suite of instruments that includes a laser altimeter, radar instruments, cameras, and a gravimeter, which is an instrument that detects small changes in gravity. These small changes reveal how much mass these glaciers have lost. Repeated annual measurements of key glaciers maintains a long-term record of change in the Antarctic that goes back to NASA’s Ice, Cloud and Land Elevation Satellite (ICESat) which stopped collecting data in 2009.
IceBridge researchers plan to measure previously unsurveyed regions of Antarctica. One example is a plan to look at the upper portions of Smith Glacier in West Antarctica, which is thinning faster than any other glaciers in the region. The mission also plans to collect data in portions of the Antarctic Peninsula, such as the Larsen C, George VI and Wilkins ice shelves and the glaciers that drain into them. The Antarctic Peninsula has been warming faster than the rest of the continent.
“The Antarctic Peninsula is changing fairly rapidly and we need to be there to capture that change,” said Michael Studinger, IceBridge project scientist at NASA’s Goddard Space Flight Center in Greenbelt, Maryland.
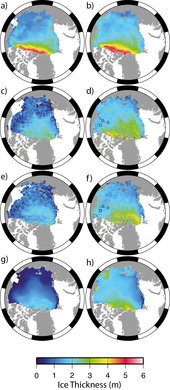
The mission also will collect data on Antarctic sea ice, which recently reached a record high coverage. This contrasts with declining sea ice in the Arctic and is due do a variety of factors such as changing wind patterns. Antarctic sea ice coverage is slightly above average and the growth varies from one part of Antarctica to another. For example, ice cover in the Bellingshausen Sea has been decreasing while ice in the nearby Ross Sea is growing.
“There are very strong regional variations on how sea ice is changing,” said Nathan Kurtz, a sea ice scientist at Goddard. These regional trends together yield a small increase, so studying each region will help scientists get a better grasp on the processes affecting sea ice there.
In addition to extending ICESat’s data record over land and sea ice, IceBridge will also help set the stage for ICESat-2 by measuring ice the satellite will fly over. One of IceBridge’s highest priority surveys is a circular flight the DC-8 will fly around the South Pole at 88 degrees south latitude. This latitude line is where all of ICESat-2’s orbits will converge in the Southern Hemisphere. Measuring ice elevation at these locations will help researchers build a time series of data that spans more than a decade and provide a way to help verify ICESat-2’s data.
IceBridge’s Antarctic field campaign will run through late November. The IceBridge project science office is based at Goddard. The DC-8 research aircraft is based at NASA’s Armstrong Flight Research Center’s facility in Palmdale, California.
For more about Operation IceBridge, visit:
NASA monitors Earth's vital signs from land, air and space with a fleet of satellites and ambitious airborne and ground-based observation campaigns. NASA develops new ways to observe and study Earth's interconnected natural systems with long-term data records and computer analysis tools to better see how our planet is changing. The agency shares this unique knowledge with the global community and works with institutions in the United States and around the world that contribute to understanding and protecting our home planet.
For more information about NASA's recent Earth science activities, visit:
NASA
Guillermo Gonzalo Sánchez Achutegui

miércoles, 22 de mayo de 2013

NASA - Launching Balloons to Study Space Weather


Download Image

› Full Size 
 NASA
Guillermo Gonzalo Sánchez Achutegui
ayabaca@gmail.com
ayabaca@hotmail.com
ayabaca@yahoo.com

domingo, 17 de febrero de 2013

ESA - CryoSat reveals major loss of Arctic sea ice


13 February 2013 An international team of scientists using new measurements from ESA’s ice mission has discovered that the volume of Arctic sea ice has declined by 36% during autumn and 9% during winter between 2003 and 2012.
Satellite records show a constant downward trend in the area covered by Arctic sea ice during all seasons, but in particular in summer. The past six years have seen the lowest summer ice extent in three decades, reaching the lowest last September at about 3.61 million sq km.
A team of scientists led by University College London has now generated estimates of the sea-ice volume for the 2010–11 and 2011–12 winters over the Arctic basin using data from ESA’s CryoSat satellite.
This study has confirmed, for the first time, that the decline in sea ice coverage in the polar region has been accompanied by a substantial decline in ice volume.
The new CryoSat dataset shows the volume’s continuing decline observed from 2003 to 2008 by NASA’s ICESat satellite.
Sea ice thickness


Since 2008, the Arctic has lost about 4300 cubic km of ice during the autumn period and about 1500 cubic km in winter.
The team confirmed CryoSat estimates using independent ground and airborne measurements carried out by ESA and international scientists during the last two years in the polar region, as well as by comparing measurements from 

“The data reveal that thick sea ice has disappeared from a region to the north of Greenland, the Canadian Archipelago and to the northeast of Svalbard,”  said Katharine Giles, co-author of the study ‘CryoSat-2 estimates of Arctic sea ice thickness and volume’, recently published online in Geophysical Research Letters.
“Other satellites have already shown drops in the area covered by Arctic sea ice as the climate has warmed, but CryoSat allows scientists to estimate the volume of sea ice – a much more accurate indicator of the changes taking place in the Arctic,” added Tommaso Parrinello, CryoSat Mission Manager.
To do this, CryoSat’s high-resolution radar altimeter sends pulses of microwave energy down towards the ice.
The energy bounces off both the top sections of ice and the water in the cracks between. The difference in height between these two surfaces allows scientists to calculate the ‘freeboard’ – the height of ice above the water – and, as a result, volume of the ice cover.
While the researchers say two years of CryoSat data aren’t indicative of a long-term change, they speculate that the lower ice thickness and volume in the winter of 2012, compared to the winter of 2011, may have contributed to the record minimum ice extent during the 2012 autumn.

ESA's ice mission
ESA’s Earth Explorer CryoSat mission is dedicated to precise monitoring of changes in the thickness of marine ice floating in the polar oceans and variations in the thickness of the vast ice sheets that blanket Greenland and Antarctica.

The findings are the result of an international collaboration between teams from University College London (UCL), ESA, the Jet Propulsion Laboratory, the University of Washington, York University, Alfred Wegener Institute for Polar and Marine Research, Woods Hole Oceanographic Institution, Morgan State University and the University of Maryland
The research was funded by the Natural Environment Research Council, ESA, the DLR German Aerospace Center, Alberta Ingenuity, the National Science Foundation, NASA and Office of Naval Research.
The lead author of this study was Professor Seymour Laxon, who passed away in early January.
Prof. Laxon was the Director of the Centre for Polar Observation and Modelling at UCL and a Principal Scientist for several ESA missions. He was part of the UCL team that proposed CryoSat to ESA in 1999, and was a key figure during the development and operational phases of the mission.
This was his first eagerly anticipated published work on CryoSat-derived sea ice record.
ESA
Guillermo Gonzalo Sánchez Achutegui
ayabaca@gmail.com
ayabaca@hotmail.com
ayabaca@yahoo.com

domingo, 10 de febrero de 2013

ESA - Week in Images


This image combines Hubble observations of M 106 with additional information captured by amateur astronomers Robert Gendler and Jay GaBany. Gendler combined Hubble data with his own observations to produce this stunning colour image. M 106 is a relatively nearby spiral galaxy, a little over 20 million light-years away.
Credits: NASA, ESA, the Hubble Heritage Team (STScI/AURA), and R. Gendler (for the Hubble Heritage Team). Acknowledgment: J. GaBany, A van der Hoeven
Mapping Mars
 
 
Mapping Mars The latest Mars image mosaic as seen through the lens of the High Resolution Stereo Camera on ESA’s Mars Express.
The mosaic comprises 2702 individual swaths of the martian surface, up to and including the spacecraft’s 10 821st orbit of the planet, which it completed on 30 June 2012.
In total, 87.8% of the surface has been mapped at any resolution, with 61.5% mapped at a resolution of 20 m per pixel or better.
Each white marker around the border of the image represents 10º of latitude or longitude.
This image was released as a Space Science Image of the Week feature on 4 February 2013.
Credits: ESA/DLR/FU Berlin (G. Neukum); images processed by F. Jansen (ESA).

Space penguin

Space penguin This Adélie Penguin is not from outer space but its nearest equivalent on Earth: Antarctica. The penguin was photographed at Terra Nova Bay, Antarctica by ESA-sponsored medical research doctor Vangelis Kaimakamis on one of his stopovers on the long voyage to Concordia research station in the heart of the white continent.
His voyage took him from Greece to Germany, Singapore, Australia and New Zealand before arriving at McMurdo base in Antarctica. From there he transferred to the Italian Zucchelli Station at Terra Nova Bay, where weather grounded him for a week.
The Adélie Penguin may have been one of the last animals Vangelis sees during his 10-month stay at Concordia because no living being can survive the harsh conditions there. With temperatures as low as –80°C, no outside help can be flown in during the winter and even the Sun does not rise above the horizon for four months.
The closest base to Concordia is the Russian Vostok outpost, some 600 km away. In comparison, the International Space Station is closer to civilisation – astronauts can escape in an emergency and land in under four hours.
Vangelis will run experiments on how people adapt to the stress of living in close isolation. The research this year will be as diverse as studying how the crew’s body posture changes and which materials are more resistant to bacterial growth.
This is one of the many ways ESA is studying human physiology and psychology in preparation for future long missions beyond Earth.
Credits: n/a

Lake Powell, United States
 
 
Lake Powell, United States This Landsat image from 19 July 2011 shows Lake Powell, a reservoir on the Colorado River in the southwestern United States. Straddling the border of the states Utah (to the north) and Arizona (to the south), it is the second largest artificial lake in the country. The area to the north of Lake Powell is known as the Grand Staircase-Escalante National Monument, and covers over 760 000 hectares. Appearing green in this false-colour image, the Kaiparowits Plateau makes up a significant portion of the Monument, with the Fiftymile mountain (dark green) separating it from the Escalante Canyons. Another feature of the Monument is the Grand Staircase – a sequence of sedimentary rock layers – part of which is visible in the lower-left corner.
This image is featured on the Earth from Space video programme.
Credits: USGS/ESA

ESO 121-6 seen by Hubble

ESO 121-6 seen by Hubble This thin, glittering streak of stars is the spiral galaxy ESO 121-6, which lies in the southern constellation of Pictor (The Painter's Easel). Viewed almost exactly side-on, the intricate structure of the swirling arms is hidden, but the full length of the galaxy can be seen — including the intense glow from the central bulge, a dense region of tightly packed young stars sitting at the centre of the spiral arms.
Tendrils of dark dust can be seen across the frame, partially obscuring the bright centre of the galaxy and continuing out towards the smattering of stars at its edges, where the dust lanes and shapes melt into the inky background. Numerous nearby stars and galaxies are visible as small smudges in the surrounding sky, and the brightest stars are dazzlingly prominent towards the bottom left of the image.
ESO 121-6 is a galaxy with patchy, loosely wound arms and a relatively faint central bulge. It actually belongs to a group of galaxies, a clump of no more than 50 similar structures all loosely bound to one another by gravity. The Milky Way is also a member of a galactic group, known as the Local Group.
Credits: ESA/Hubble & NASA
ESA
Guillermo Gonzalo Sánchez Achutegui
ayabaca@gmail.com
ayabaca@hotmail.com
ayabaca@yahoo.com 

ESA - Is the ozone layer on the road to recovery?


http://upload.wikimedia.org/wikipedia/commons/4/46/Future_ozone_layer_concentrations.gif
Full resolution(1,280 × 932 pixels, file size: 2.01 MB, MIME type: image/gif, looped, 6 frames, 18 s)
NASA projections of stratospheric ozone concentrations if chlorofluorocarbons had not been banned.

Regulation

In 1978, the United States, Canada and Norway enacted bans on CFC-containing aerosol sprays that are thought to damage the ozone layer. The European Community rejected an analogous proposal to do the same. In the U.S., chlorofluorocarbons continued to be used in other applications, such as refrigeration and industrial cleaning, until after the discovery of the Antarctic ozone hole in 1985. After negotiation of an international treaty (the Montreal Protocol), CFC production was sharply limited beginning in 1987 and phased out completely by 1996.[citation needed] Since that time, the treaty has been amended to ban CFC production after 1995 in the developed countries, and later in developing. Today, over 160 countries have signed the treaty. Beginning January 1, 1996, only recycled and stockpiled CFCs will be available for use in developed countries like the US. This production phaseout is possible because of efforts to ensure that there will be substitute chemicals and technologies for all CFC uses.[7]
On August 2, 2003, scientists announced that the depletion of the ozone layer may be slowing down due to the international ban on CFCs.[8] Three satellites and three ground stations confirmed that the upper atmosphere ozone depletion rate has slowed down significantly during the past decade. The study was organized by the American Geophysical Union. Some breakdown can be expected to continue due to CFCs used by nations which have not banned them, and due to gases which are already in the stratosphere. CFCs have very long atmospheric lifetimes, ranging from 50 to over 100 years. It has been estimated that the ozone layer may not recover until 2075.[9]
Compounds containing C–H bonds (such as hydrochlorofluorocarbons, or HCFCs) have been designed to replace the function of CFCs. These replacement compounds are more reactive and less likely to survive long enough in the atmosphere to reach the stratosphere where they could affect the ozone layer. While being less damaging than CFCs, HCFCs can have a negative impact on the ozone layer, so they are also being phased out.[10]
Wikipedia.
File:Ozone cycle.svgFull resolution(SVG file, nominally 1,052 × 744 pixels, file size: 420 KB)

The ozone layer is a layer in Earth's atmosphere containing relatively high concentrations of ozone (O3). However, "relatively high," in the case of ozone, is still very small with regard to ordinary oxygen, and is less than ten parts per million, with the average ozone concentration in Earth's atmosphere being only about 0.6 parts per million. The ozone layer is mainly found in the lower portion of the stratosphere from approximately 20 to 30 kilometres (12 to 19 mi) above Earth, though the thickness varies seasonally and geographically.[1]
The ozone layer was discovered in 1913 by the French physicists Charles Fabry and Henri Buisson. Its properties were explored in detail by the British meteorologist G. M. B. Dobson, who developed a simple spectrophotometer (the Dobsonmeter) that could be used to measure stratospheric ozone from the ground. Between 1928 and 1958 Dobson established a worldwide network of ozone monitoring stations, which continue to operate to this day. The "Dobson unit", a convenient measure of the columnar density of ozone overhead, is named in his honor.
The ozone layer absorbs 97–99% of the Sun's medium-frequency ultraviolet light (from about 200 nm to 315 nm wavelength), which potentially damages exposed life forms on Earth.[2]
Wikipedia.

8 February 2013 Satellites show that the recent ozone hole over Antarctica was the smallest seen in the past decade. Long-term observations also reveal that Earth’s ozone has been strengthening following international agreements to protect this vital layer of the atmosphere.
According to the ozone sensor on Europe’s MetOp weather satellite, the hole over Antarctica in 2012 was the smallest in the last 10 years.
The instrument continues the long-term monitoring of atmospheric ozone started by its predecessors on the ERS-2 and Envisat satellites.
Since the beginning of the 1980s, an ozone hole has developed over Antarctica during the southern spring – September to November – resulting in a decrease in ozone concentration of up to 70%.
South Pole ozone
Ozone depletion is more extreme in Antarctica than at the North Pole because high wind speeds cause a fast-rotating vortex of cold air, leading to extremely low temperatures. Under these conditions, human-made chlorofluorocarbons – CFCs – have a stronger effect on the ozone, depleting it and creating the infamous hole.
Over the Arctic, the effect is far less pronounced because the northern hemisphere’s irregular landmasses and mountains normally prevent the build-up of strong circumpolar winds.
Reduced ozone over the southern hemisphere means that people living there are more exposed to cancer-causing ultraviolet radiation.
International agreements on protecting the ozone layer – particularly the Montreal Protocol – have stopped the increase of CFC concentrations, and a drastic fall has been observed since the mid-1990s.
However, the long lifetimes of CFCs in the atmosphere mean it may take until the middle of this century for the stratosphere’s chlorine content to go back to values like those of the 1960s.
The evolution of the ozone layer is affected by the interplay between atmospheric chemistry and dynamics like wind and temperature.
If weather and atmospheric conditions show unusual behaviour, it can result in extreme ozone conditions – such as the record low observed in spring 2011 in the Arctic – or last year’s unusually small Antarctic ozone hole.
Total ozone
To understand these complex processes better, scientists rely on a long time series of data derived from observations and on results from numerical simulations based on complex atmospheric models.
Although ozone has been observed over several decades with multiple instruments, combining the existing observations from many different sensors to produce consistent and homogeneous data suitable for scientific analysis is a difficult task.
Within the ESA Climate Change Initiative, harmonised ozone climate data records are generated to document the variability of ozone changes better at different scales in space and time.
With this information, scientists can better estimate the timing of the ozone layer recovery, and in particular the closure of the ozone hole.
Chemistry climate models show that the ozone layer may be building up, and the hole over Antarctica will close in the next decades.
ESA
Guillermo Gonzalo Sánchez Achutegui
ayabaca@gmail.com
ayabaca@hotmail.com
ayabaca@yahoo.com

lunes, 4 de febrero de 2013

NASA - NASA's Super-Tiger Balloon Breaks Records While Collecting Data

NASA's Three Long Duration Balloon Missions Working Over Antarctica
2013-01-08


For the second time, the NASA Scientific Balloon Program managed at NASA’s Wallops Flight Facility, Wallops Island, VA, has three separate Long Duration Balloon (LDB) science missions afloat collecting data simultaneously. The previous time was during the 2007-2008 Antarctic campaign.

McMurdo Station, Antarctica The three missions in the current Antarctic summer Campaign, SuperTIGER, BLAST, and EBEX, were launched by NASA’s Columbia Scientific Balloon Facility (CSBF) in December 2012 from the LDB site near McMurdo Station, Antarctica.

The LDB site was established at Willy Field, McMurdo Station, in order to take advantage of the stratospheric anticyclone wind pattern circulating from east to west around the South Pole. The stratospheric wind circulation combined with the sparsely populated continent of Antarctica allows for long duration balloon flights at altitudes above 100,000 feet.

Super-TIGER was launched at 3:45 pm EST Dec 8, 2012. Super-TIGER, or Super Trans-Iron Galactic Element Recorder, is flying a new instrument for measuring the rare heavy elements among the flux of high-energy cosmic rays bombarding the Earth from elsewhere in our Milky Way Galaxay. The information retrieved from this mission will be used to develop an understanding where these energetic atomic nuclei are produced and how they achieve their very high energies.

The principal investigator of the SuperTIGER mission is Dr. Walter Binns of Washington University, St. Louis, Mo. The 39-million cubic foot scientific balloon is carrying SuperTIGER at a float altitude of 127,000 feet.

The second mission to launch in the campaign was BLAST, or the Balloon Borne Large Aperture Submillimeter Telescope, launched Dec. 25 at 1:57 p.m. EST. Galactic magnetic fields can polarize submillimeter-emitting micron-sized dust particles in star forming regions. The resulting emission is slightly polarized. By measuring the level of polarization, BLAST can help determine if magnetic fields are a dominant force over turbulence in regulating star formation in our Galaxy.

BLAST’s principal investigator is Dr. Mark Devlin of the University of Pennsylvania in Philadelphia. The 39-million cubic foot scientific balloon is at a float altitude of 126,000 feet.

The third and final mission of the Antarctic campaign was the heaviest payload ever launched aboard a NASA scientific balloon. Weighing in at 8,000 pounds, the EBEX experiment launched Dec. 29 at 7:27 p.m. EST. EBEX, or E&B Experiment, measures cosmic microwave background radiation, particularly its polarization. The cosmic microwave background is a type of radiation that fills the entire observable universe and is a relic remnant from the beginning of the universe. The discovery of the cosmic microwave background in the 1960's is a landmark confirmation of the big-bang model. EBEX is searching for signals from an inflationary expansion of the universe, which is thought to have taken place a fraction of a second after the big bang. Aside from being the heaviest payload ever launched aboard a NASA scientific balloon, EBEX is physically the largest payload ever to be flown by any balloon program worldwide. The 34 million cubic foot scientific balloon is carrying EBEX at a float altitude of 118,000 feet.

The principal investigator of the EBEX mission is Dr. Shaul Hanany of the University of Minnesota, Minneapolis, MN.

All three missions are still afloat over the Antarctic continent. They are monitored from the Operations Control Center at NASA’s CSBF in Palestine, Texas. BLAST and EBEX will stay afloat for another week; the flights will then be terminated at a location near McMurdo Station. SuperTIGER may stay afloat for several more weeks.

“I’m very proud of the NASA, CSBF, science, NSF/OPP and USAP personnel who have made this tremendous achievement possible” said Debora Fairbrother, chief of the NASA Balloon Program Office.

The National Science Foundation Office of Polar Programs manages the U.S. Antarctic Program and provides logistic support for all U.S. scientific operations in Antarctica. The NSF Antarctic Support Contractor (ASC) provides material support to the NASA Balloon Program, including support of launch and recovery operations throughout the Antarctic Campaign.

In addition, the Balloon Array for RPSP (Radiation Belt Storm Probes) Relativistic Electron Losses (BARREL) campaign is being conducted separately and independently of the NASA Balloon Program’s LDB Antarctic Campaign. The BARREL missions are hand launched balloons conducted by the science team from the remote sites of SANAE IV and Halley Research Station.

To follow the BARREL campaign activities, 
visit: http://relativisticballoons.blogspot.com/

To monitor the real time flight tracks of the balloons on the Internet, 
visit: http://www.csbf.nasa.gov/antarctica/ice.htm

For more information about NASA's balloon program on the Internet, 
 

Feature Articles


NASA's Three Long Duration Balloon Missions Working Over Antarctica - Jan 08, 2013
For the second time, the NASA Scientific Balloon Program managed at NASA’s Wallops Flight Facility, Wallops Island, VA, has three separate Long Duration Balloon (LDB)… Read More


Christmas Day BLAST! - Dec 26, 2012
NASA launched the Balloon-borne Large-Aperture Submillimeter Telescope or BLAST payload Dec. 25 from McMurdo Station, Antarctica, using a long duration balloon or LDB… Read More


Antarctic Balloon Campaign Underway - Dec 10, 2012
NASA's Balloon Program Office based at Wallops Flight Facility kicked off the winter Antarctic balloon campaign this weekend in McMurdo Station, Antarctica. On Saturday, December 8, the SuperTIGER payload was launched… Read More


NASA's Balloon Program Prepares for Antarctic Campaign! - Nov 27, 2012
NASA's Balloon Program Office based at Wallops Flight Facility is preparing for the annual winter Antarctic Campaign in McMurdo Station, Antarctica. This year's campaign features three missions: Super-TIGER, EBEX, and… Read More


2011-2012 Antarctica Campaign - Feb 8, 2012
After a late start the Antarctica campaign closed out with the successful flights of CREST and STO. Cosmic Ray Electron Synchrotron Telescope (CREST) - Dr. James Musser, Indiana University, was launched on December 25, and was… Read More

Code 820


Quick Links

NASA's Super-Tiger Balloon Breaks Records While Collecting Data
 
 
WASHINGTON -- A large NASA science balloon has broken two flight duration records while flying over Antarctica carrying an instrument that detected 50 million cosmic rays.

The Super Trans-Iron Galactic Element Recorder (Super-TIGER) balloon launched at 3:45 p.m. EST, Dec. 8 from the Long Duration Balloon site near McMurdo Station. It spent 55 days, 1 hour, and 34 minutes aloft at 127,000 feet, more than four times the altitude of most commercial airliners, and was brought down to end the mission on Friday. Washington University of St. Louis managed the mission.

On Jan. 24, the Super-TIGER team broke the record for longest flight by a balloon of its size, flying for 46 days. The team broke another record Friday after landing by becoming the longest flight of any heavy-lift scientific balloon, including NASA's Long Duration Balloons. The previous record was set in 2009 by NASA's Super Pressure Balloon test flight at 54 days, 1 hour, and 29 minutes.

"Scientific balloons give scientists the ability to gather critical science data for a long duration at a very low relative cost," said Vernon Jones, NASA's Balloon Program Scientist.

Super-TIGER flew a new instrument for measuring rare elements heavier than iron among the flux of high-energy cosmic rays bombarding Earth from elsewhere in our Milky Way galaxy. The information retrieved from this mission will be used to understand where these energetic atomic nuclei are produced and how they achieve their very high energies.

The balloon gathered so much data it will take scientists about two years to analyze it fully.

"This has been a very successful flight because of the long duration, which allowed us to detect large numbers of cosmic rays," said Dr. Bob Binns, principal investigator of the Super-TIGER mission. "The instrument functioned very well."

The balloon was able to stay aloft as long as it did because of prevailing wind patterns at the South Pole. The launch site takes advantage of anticyclonic, or counter-clockwise, winds circulating from east to west in the stratosphere there. This circulation and the sparse population work together to enable long-duration balloon flights at altitudes above 100,000 feet.

The National Science Foundation (NSF) Office of Polar Programs manages the U.S. Antarctic Program and provides logistic support for all U.S. scientific operations in Antarctica. NSF's Antarctic support contractor supports the launch and recovery operations for NASA's Balloon Program in Antarctica. Mission data were downloaded using NASA's Tracking and Data Relay Satellite System.

For more information about NASA's Balloon Program, visit:
NASA
Guillermo Gonzalo Sánchez Achutegui
ayabaca@gmail.com
ayabaca@hotmail.com
ayabaca@yahoo.com 

domingo, 2 de diciembre de 2012

NASA - NASA Researchers Discover Ancient Microbes in Antarctic Lake

WASHINGTON -- In one of the most remote lakes of Antarctica, nearly 65 feet beneath the icy surface, scientists from NASA, the Desert Research Institute (DRI) in Reno, Nev., the University of Illinois at Chicago, and nine other institutions, have uncovered a community of bacteria. This discovery of life existing in one of Earth's darkest, saltiest and coldest habitats is significant because it helps increase our limited knowledge of how life can sustain itself in these extreme environments on our own planet and beyond.

Lake Vida, the largest of several unique lakes found in the McMurdo Dry Valleys, contains no oxygen, is mostly frozen and possesses the highest nitrous oxide levels of any natural water body on Earth. A briny liquid, which is approximately six times saltier than seawater, percolates throughout the icy environment where the average temperature is minus 8 degrees Fahrenheit. The international team of scientists published their findings online Nov. 26, in the Proceedings of the National Academy of Sciences Early Edition.

"This study provides a window into one of the most unique ecosystems on Earth," said Alison Murray, a molecular microbial ecologist and polar researcher at the DRI and the report's lead author. "Our knowledge of geochemical and microbial processes in lightless icy environments, especially at subzero temperatures, has been mostly unknown up until now. This work expands our understanding of the types of life that can survive in these isolated, cryoecosystems and how different strategies may be used to exist in such challenging environments."

Despite the very cold, dark and isolated nature of the habitat, the report finds the brine harbors a surprisingly diverse and abundant variety of bacteria that survive without a current source of energy from the sun. Previous studies of Lake Vida dating back to 1996 indicate the brine and its inhabitants have been isolated from outside influences for more than 3,000 years.

"This system is probably the best analog we have for possible ecosystems in the subsurface waters of Saturn's moon Enceladus and Jupiter's moon Europa," said Chris McKay, a senior scientist and co-author of the paper at NASA's Ames Research Center, Moffett Field, Calif.

Murray and her co-authors and collaborators, including Peter Doran, the project's principal investigator at the University of Illinois at Chicago, developed stringent protocols and specialized equipment for their 2005 and 2010 field campaigns to sample from the lake brine while avoiding contaminating the pristine ecosystem.

"The microbial ecosystem discovered at Lake Vida expands our knowledge of environmental limits for life and helps define new niches of habitability," said Adrian Ponce, co-author from NASA's Jet Propulsion Laboratory, Pasadena, Calif., who enumerated viable bacterial spore populations extracted from Lake Vida.

To sample unique environments such as this, researchers must work under secure, sterile tents on the lake's surface. The tents kept the site and equipment clean as researchers drilled ice cores, collected samples of the salty brine residing in the lake ice and assessed the chemical qualities of the water and its potential for harboring and sustaining life.

Geochemical analyses suggest chemical reactions between the brine and the underlying iron-rich sediments generate nitrous oxide and molecular hydrogen. The latter, in part, may provide the energy needed to support the brine's diverse microbial life.

Additional research is under way to analyze the abiotic, chemical interactions between the Lake Vida brine and its sediment, in addition to investigating the microbial community by using different genome sequencing approaches. The results could help explain the potential for life in other salty, cryogenic environments beyond Earth, such as purported subsurface aquifers on Mars.

This study was partially funded by the NASA Astrobiology Program in collaboration with the University of Illinois at Chicago and the Desert Research Institute, a nonprofit research campus of the Nevada System of Higher Education.

For more information about DRI, visit:


For more information about the NASA Astrobiology Program, visit:
http://www.dri.edu/images/stories/divisions/dees/deesnews/112612-2-1-06a_m08trim1micron.jpgScanning electron micrograph of very small and numerous bacterial cells inhabiting icy brine channels in Antarctica’s Lake Vida, which lies in the Victoria Valley, one of the northernmost of the Antarctic dry valleys.  
Credit: Christian H. Fritsen, Desert Research Institute

Ancient Microbes Found Living Beneath the Icy Surface of Antarctic Lake
DRI scientists’ co-author study examining life in one of Earth’s coldest, ice-sealed ecosystems
FOR IMMEDIATE RELEASE: November 26, 2012
RENO – This week a pioneering study published in the Proceedings of the National Academy of Science (PNAS) and co-authored by Dr. Alison Murray and Dr. Christian Fritsen of Nevada’s Desert Research Institute (DRI) reveals, for the first time, a viable community of bacteria that survives and ekes out a living in a dark, salty and subfreezing environment beneath nearly 20 meters of ice in one of Antarctica’s most isolated lakes.
112612-CoringAtVida Kuhn-thbMembers of the Lake Vida expedition team.
Enlarge image for caption.
Lake Vida, the largest of several unique lakes found in the McMurdo Dry Valleys, contains no oxygen, is mostly frozen and possesses the highest nitrous oxide levels of any natural water body on Earth. A briny liquid that is approximately six times saltier than seawater percolates throughout the icy environment that has an average temperature of minus 13.5 degrees centigrade (or 8 degrees Fahrenheit).
“This study provides a window into one of the most unique ecosystems on Earth,” said Murray, the report’s lead author, and molecular microbial ecologist and polar researcher for the past 17 years, who has participated in 14 expeditions to the Southern Ocean and Antarctic continent. “Our knowledge of geochemical and microbial processes in lightless icy environments, especially at subzero temperatures, has been mostly unknown up until now. This work expands our understanding of the types of life that can survive in these isolated, cryoecosystems and how different strategies may be used to exist in such challenging environments.”
112612-22 LakeVidaCampsat-Murray-thbResearch field camp on Lake Vida, Victoria Valley.
Enlarge image for caption.
Despite the very cold, dark and isolated nature of the habitat, the report finds that the brine harbors a surprisingly diverse and abundant assemblage of bacteria that survive without a present-day source of energy from the sun. Previous studies of Lake Vida dating back to 1996 indicate that the brine and its’ inhabitants have been isolated from outside influences for more than 3,000 years.
Murray and her co-authors and collaborators, including the project’s principal investigator Dr. Peter Doran of the University of Illinois at Chicago, developed stringent protocols and specialized equipment for their 2005 and 2010 field campaigns to sample the lake brine while avoiding contaminating the pristine ecosystem.
To sample the unique environment researchers worked under secure, sterile tents on the lake’s surface to keep the site and equipment clean as they drilled ice cores, collected samples of the salty brine residing in the lake ice and then assessed the chemical qualities of the water and its potential for harboring and sustaining life, in addition to describing the diversity of the organisms detected.
112612-2-1-06a m08trim1micron-thbBacterial cells inhabiting icy brine channels, Lake Vida.
Enlarge photo for caption.
Geochemical analyses suggest that chemical reactions between the brine and the underlying iron-rich sediments generate nitrous oxide and molecular hydrogen. The latter, in part, may provide the energy needed to support the brine’s diverse microbial life.
“It’s plausible that a life-supporting energy source exists solely from the chemical reaction between anoxic salt water and the rock,” explained Fritsen, a systems microbial ecologist and Research Professor in DRI’s Division of Earth and Ecosystem Sciences.
“If that’s the case,” echoed Murray. “This gives us an entirely new framework for thinking of how life can be supported in cryoecosystems on earth and in other icy worlds of the universe."
Murray added further research is currently under way to analyze the abiotic, chemical interactions between the Lake Vida brine and the sediment, in addition to investigating the microbial community by using different genome sequencing approaches. The results could help explain the potential for life in other salty, cryogenic environments beyond Earth.
The Lake Vida brine also represents a cryoecosystem that is a suitable and accessible analog for the soils, sediments, wetlands, and lakes underlying the Antarctic ice sheet that other polar researchers are just now beginning to explore.
The funding for this research was supported jointly by NSF and NASA.

About the Desert Research Institute:

DRI, the nonprofit research campus of the Nevada System of Higher Education, strives to be the world leader in environmental sciences through the application of knowledge and technologies to improve people’s lives throughout Nevada and the world.
All DRI news releases available at: http://news.dri.edu/

Additional Details:

Proceedings of the National Academy of Science (PNAS)
Article #12-08607 - “Microbial Life at -13 ºC in the Brine of an Ice-Sealed Antarctic Lake,” by Alison E. Murray et al.
More information on the Lake Vida project can be found online at: http://www.dri.edu/lake-vida

Photographs and Video available:

Field Work – including the ice core drilling process, Antarctic expedition, ice cores, and Lake Vida research team members.

Note to Reporters and Editors: DRI, the nonprofit research campus of the Nevada System of Higher Education, strives to be the world leader in environmental sciences through the application of knowledge and technologies to improve people’s lives throughout Nevada and the world.

DRI News & Communications
Communications at DRI is the main contact for media relations. When faculty members are contacted by the media, they are encouraged to notify Communications for assistance.
Communications is responsible for DRI's news releases, the DRI Newsletter and Magazine, and top-level content on the DRI website. Communications also assists the President's office with public relations, public events, development and marketing.
Official DRI news releases are available below.
Filter by title     Display 
# Date Title
1 11/30/12 Desert Research Institute names new DRI Foundation trustees and board leadership
2 11/28/12 Renowned Soil Physicist to Visit, Speak at DRI's Southern Nevada Science Center
3 11/26/12 Ancient Microbes Found Living Beneath the Icy Surface of Antarctic Lake
4 10/10/12 Nevada’s Top Energy Industry Representatives Gather at DRI, Call for More Collaboration and Education
5 10/09/12 DRI Scientist Co-authors Study Outlining Vast Differences in Polar Ocean Microbial Communities
6 10/04/12 DRI Receives $100,000 Funding Recommendation to Help Sustain Cloud Seeding Operations
7 10/04/12 DRI Scientist Will Co-lead Field Work and Sampling on NASA Astrobiology Institute Search for Extreme Life
8 09/27/12 26th DRI Nevada Medal to Honor Renowned Geneticist Dr. Nina Fedoroff
9 09/24/12 Gov. Sandoval's Trade Mission Highlights DRI's International Research
10 09/17/12 DRI Leaders Join Governor Sandoval for First of Its kind Trade Mission to China, South Korea
<< Start < Prev 1 2 3 4 Next > End >>
Page 1 of 4

Note to Reporters and Editors: DRI, the nonprofit research campus of the Nevada System of Higher Education, strives to be the world leader in environmental sciences through the application of knowledge and technologies to improve people’s lives throughout Nevada and the world.
NASA
Guillermo Gonzalo Sánchez Achutegui 
ayabaca@gmail.com
ayabaca@hotmail.com
ayabaca@yahoo.com

ESA - Observing the Earth - Clearest evidence yet of polar ice losses


http://www.esa.int/images/glacier-ERS1-2_1992-2011_H,0.gif

 Retreating ice stream
Download:
 HI-RES GIF (Size: 3598 kb 
Images of the Kangerdlugssuaq glacier in eastern Greenland from 1992 and 2011 from the ERS mission. The ice stream’s calving front retreated by five kilometres over 19 years. Thinning in the ice steam and surrounding ice sheet is also evident. 
Credits: ESA

After two decades of satellite observations, an international team of experts brought together by ESA and NASA has produced the most accurate assessment of ice losses from Antarctica and Greenland to date. This study finds that the combined rate of ice sheet melting is increasing.

The new research shows that melting of the Antarctic and Greenland ice sheets has added 11.1 mm to global sea levels since 1992. This amounts to about 20% of all sea-level rise over the survey period.
About two thirds of the ice loss was from Greenland, and the remainder was from Antarctica.
Although the ice sheet losses fall within the range reported by the Intergovernmental Panel on Climate Change in 2007, the spread of the estimate at that time was so broad that it was not clear whether Antarctica was growing or shrinking.
The new estimates are a vast improvement – more than twice as accurate – thanks to the inclusion of more satellite data, and confirm that both Antarctica and Greenland are losing ice.
The study also shows that the combined rate of ice sheet melting has increased over time and, altogether, Greenland and Antarctica are now losing more than three times as much ice, equivalent to 0.95 mm of sea-level rise per year, as they were in the 1990s, equivalent to 0.27 mm of sea level rise per year. 
The 47 experts combined observations from 10 different satellite missions to reconcile the differences between dozens of earlier ice sheet studies and produce the first consistent measurement of polar ice sheet changes.
Earth observation satellites are key to monitoring the polar ice because they carry instruments that measure changes in the thickness of the ice sheets, fluctuations in the speed of the outlet glaciers and even small changes in Earth’s gravity field caused by melting ice.
As outlined in the paper ‘A Reconciled Estimate of Ice Sheet Mass Balance’ published today in Science, the researchers carefully matched time periods and survey areas, and combined measurements from European, Canadian, American and Japanese satellites.
The measurement were acquired by instruments such as the radar altimeters and synthetic aperture radars flown on ESA’s ERS-1, ERS-2 and Envisat missions from 1991.
“The success of this venture is due to the cooperation of the international scientific community, and to the provision of precise satellite sensors by our space agencies,” said Professor Andrew Shepherd from the University of Leeds and one of the leaders of the study.
“Without these efforts, we would not be in a position to tell people with confidence how Earth’s ice sheets have changed, and to end the uncertainty that has existed for many years.”


 Ice loss and sea level rise
Cumulative changes in the mass of the Antarctic ice sheet (pink) and the Greenland ice sheet (blue) from 1992 to 2011 determined from a reconciliation of measurements acquired by satellite radar altimetry, the input-output method, satellite gravimetry and satellite laser altimetry. Also shown is the equivalent global sea level contribution, calculated assuming that 360 gigatonnes of ice corresponds to 1 mm of sea level rise. Credits: Shepherd, Ivins et al.

The study also found variations in the pace of ice sheet change in Antarctica and Greenland.
“The rate of ice loss from Greenland has increased almost five-fold since the mid-1990s.
“In contrast, while the regional changes in Antarctic ice over time are sometimes quite striking, the overall balance has remained fairly constant – at least within the certainty of the satellite measurements we have to hand,” said co-leader of the study Dr Erik Ivins from NASA’s Jet Propulsion Laboratory.
The Ice Sheet Mass Balance Inter-comparison Exercise is a collaboration between 47 researchers from 26 laboratories, supported by ESA and NASA.
Europe’s Global Monitoring for Environment and Security programme will continue to monitor changes in the polar ice sheets during the coming decades, with the SAR and radar altimeter sensors on the Sentinel-1 and Sentinel-3 satellite series, scheduled to be launched from 2013 onwards.
http://www.esa.int/images/change_in_icesheet_H.jpg
Change in ice sheet thickness per year
Download:
 HI-RES JPEG (Size: 1730 kb)
Change in ice sheet thickness per year in Greenland (left) and Antarctica (right). Dark red depicts a thinning of about 50 cm per year, while purple areas experience a thickening of about 20 cm per year. 
Credits: Planetary Visions, DTU (Greenland), UCL (Antarctica)
ESA
Guillermo Gonzalo Sánchez Achutegui
ayabaca@gmail.com
ayabaca@hotmail.com
ayabaca@yahoo.com

martes, 13 de noviembre de 2012

NASA - Sheldon Glacier


Download Image

› Full Size 
 NASA
Guillermo Gonzalo Sánchez Achutegui
ayabaca@gmail.com
ayabaca@hotmail.com
ayabaca@yahoo.com

domingo, 29 de abril de 2012

Warm Ocean Currents Cause Majority of Ice Loss from Antarctica

Hi My Friends: AL VUELO DE UN QUINDE EL BLOG., Warm ocean currents attacking the underside of ice shelves are the dominant cause of recent ice loss from Antarctica, a new study using measurements from NASA's Ice, Cloud, and land Elevation Satellite (ICESat) revealed.


Warm Ocean Currents Cause Majority of Ice Loss from Antarctica :
WASHINGTON -- Warm ocean currents attacking the underside of ice shelves are the dominant cause of recent ice loss from Antarctica, a new study using measurements from NASA's Ice, Cloud, and land Elevation Satellite (ICESat) revealed.

An international team of scientists used a combination of satellite measurements and models to differentiate between the two known causes of melting ice shelves: warm ocean currents thawing the underbelly of the floating extensions of ice sheets and warm air melting them from above. The finding, published today in the journal Nature, brings scientists a step closer to providing reliable projections of future sea level rise.

The researchers concluded 20 of the 54 ice shelves studied are being melted by warm ocean currents. Most of these are in West Antarctica, where inland glaciers flowing down to the coast and feeding into these thinning ice shelves have accelerated, draining more ice into the sea and contributing to sea-level rise. This ocean-driven thinning is responsible for the most widespread and rapid ice losses in West Antarctica and the majority of Antarctic ice sheet loss during the period studied.

"We can lose an awful lot of ice to the sea without ever having summers warm enough to make the snow on top of the glaciers melt," said the study's lead author Hamish Pritchard of the British Antarctic Survey in Cambridge, United Kingdom. "The oceans can do all the work from below."

To map the changing thickness of almost all the floating ice shelves around Antarctica, the team used a time series of 4.5 million surface height measurements taken by a laser instrument mounted on ICESat from October 2003 to October 2008. They measured how the ice shelf height changed over time and ran computer models to discard changes in ice thickness because of natural snow accumulation and compaction. The researchers also used a tide model that eliminated height changes caused by tides raising and lowering the ice shelves.

"This study demonstrates the power of space-based, laser altimetry for understanding Earth processes," said Tom Wagner, cryosphere program scientist at NASA Headquarters in Washington." Coupled with NASA's portfolio of other ice sheet research using data from our GRACE mission, satellite radars and aircraft, we get a comprehensive view of ice sheet change that improves estimates of sea level rise."

Previous studies used satellite radar data to measure the evolution of ice shelves and glaciers, but laser measurements are more precise in detecting changes in ice shelf thickness through time. This is especially true in coastal areas. Steeper slopes at the grounding line, where floating ice shelves connect with the landmass, cause problems for lower-resolution radar altimeters.

ICESat was the first satellite specifically designed to use laser altimetry to study the Earth's polar regions. It operated from 2003 to 2009. Its successor, ICESat-2, is scheduled for launch in 2016.

"This study demonstrates the urgent need for ICESat-2 to get into space," said Jay Zwally, ICESat project scientist at NASA's Goddard Space Flight Center in Greenbelt, Md. "We have limited information on the changes in polar regions caused by climate change. Nothing can look at these changes like satellite measurements do."

The new research also links the observed increase in melting that occurs on the underside of a glacier or ice shelf, called basal melt, and glacier acceleration with changes in wind patterns.

"Studies have shown Antarctic winds have changed because of changes in climate," Pritchard said. "This has affected the strength and direction of ocean currents. As a result warm water is funnelled beneath the floating ice. These studies and our new results suggest Antarctica's glaciers are responding rapidly to a changing climate."

A different picture is seen on the Antarctic Peninsula, the long stretch of land pointing towards South America. The study found thinning of the largest ice shelf on the peninsula can be explained by warm summer winds directly melting the snow on the ice shelf surfaces. The patterns of widespread ocean-driven melting and summer melting on the Antarctic Peninsula can be attributed to changing wind patterns.

The study was carried out by an international team from the British Antarctic Survey, Utrecht University in Utrecht, Netherlands, the University of California in San Diego and the non-profit research institute Earth and Space Research in Corvallis, Ore.

For more information, a visualization and related imagery, visit:
http://www.nasa.gov/topics/earth/features/currents-ice-loss.html
Guillermo Gonzalo Sánchez Achutegui
ayabaca@gmail.com
ayabaca@hotmail.com
ayabaca@yahoo.com
For more information about ICESat and ICESat-2, visit:
http://icesat.gsfc.nasa.gov/